


We can comprehensively manage your literature screening requirements in a highly economical manner. MC has designed a state-of-the-art platform to identify, organize, and analyze scientific and healthcare related data from published and grey literatures, conferences/meeting abstracts, systematic reviews, regulatory documents, drug labels, and clinical guidelines. We thoroughly screen the articles using user-defined inclusion and exclusion criteria and arrive at the studies reporting significant data of interest.
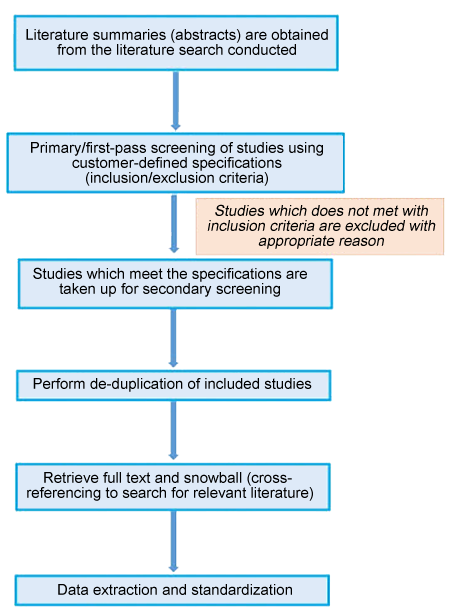
Our literature screening methodology involves two passes:
Primary screening (first pass)
- A team of independent reviewers examine title and abstract with a qualified individual available for conflicts
- A log of excluded studies with reasons for exclusion is maintained
Secondary screening (second pass)

- Full text is reviewed
- Every study which meets the inclusion criteria is assessed for quality
- Further studies may be excluded (included?)if required
MC transforms static information from full-text articles into an interactive and highly structured evidence tool. This data is easily accessible through a secure, web-based platform. Our team of experienced and highly trained specialists in evidence-based medicine, extract the data from full-texts of included studies, which are then hierarchically organized into highly structured data sets for easy analysis.
The PRISMA flow diagram depicts information about the number of records
- Identified in the literature searches
- Included for further evidence synthesis
- Excluded, with reasons for exclusion.
The data extracted from individual studies can be used to conduct evidence syntheses and statistical analyses.
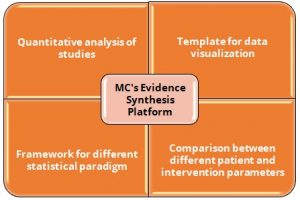
MC’s evidence synthesis platform outlines the quantitatively generated, value-focused dataset, mined from the literature. We provide a framework for quantitatively analyzing the gaps present in the trials, in terms of assessing the patient baseline characteristics, demographics, normalization of study terms, and other outcome specific parameters such as safety and efficacy outcomes.
The quantitatively presented data can be creatively visualized using MC’s interactive data visualizers (like DETViz™) that enable simplified analysis of the complex datasets. Furthermore, we validate the data thus obtained with full-text hyperlinks, thereby facilitating its easy accessibility to the users.
Key Highlights
-
- Quantitative analysis of the evidence gaps, map of studies related with various treatment outcomes
- Acts as a template in generating statistically visualizable data in the form of charts, graphs, which helps in the coherent representation of data
- Provides a framework for developing various statistical paradigm such as meta-analysis and Bayesian analysis, among others
- To compare the outcomes among different patient and intervention parameters such as baseline characteristics and fixed dose administrations, among others